Google AdWords: How to Analyze Competition with the Auction Insights Report
Google AdWords is a good way for website operators to generate paid traffic within a short period of time. But how can I compare my performance with that of my competitors?
The ongoing campaigns with their displays, display groups, and
keywords deliver a huge amount of data. Clicks, impressions, CPCs, and
conversions are a few examples of the many available metrics.
However, how your own campaigns and their keywords perform in
comparison to the competition is not easily apparent. For this, the
auction insights report can provide valuable data to webmasters. The
auction insights can be found in Google AdWords either on a campaign,
display group, or keyword level under the menu point Details.
A clear advantage for this comprehensive competition analysis in
AdWords is that the data stems directly and genuinely from Google.
Below, three metrics are presented that provide you with approaches for
optimizing compared to your competition.
The Impression Share – Who Gets the Most Impressions?
The first metric to be considered is the impression share. This shows which competitor records the greatest amount of impressions for itself. This KPI can be viewed from various angles.
- Which competitor dominates the impression share over all campaigns?
- Which competitors are fighting for impressions for each campaign?
- Related to this: Which are the best- and poorest-performing display groups?
- For which keywords is there competition for impressions?
The levels of the auction insights report show the level of an
AdWords account: account level, campaign level, and keyword level.
Performance can be checked at each level. In general, it is apparent who
exactly the competitors are and how they perform. In addition, indirect
competitors can be identified whose offer does not overlap 100% with
your own offering.
Figure 1: The auction insights report can be found under Details.
The following scenarios can be derived from the data analysis.
1. The impression share is very good in comparison to the competition.
With regard to the impression share, competitors can’t keep up, and
your own displays gain the greatest number of impressions. This is the
ideal case, but there is still potential for optimization: the bids are
possibly estimated too high and the costs are thus unnecessarily high.
Of course, with AdWords, you are dealing with so-called runner-up
auctions; nevertheless, competitors can increase their bids. Their goal
is to demand more impressions, therefore increasing your costs of a
higher click price. You have the opportunity to lower the bid and
therefore keep your own market portion constant.
2. Your own impression share is good, but competitors perform better.
This scenario is not necessarily completely negative, because in the
end your own campaigns receive impressions and can be increased through
the increase of your own bids. This serves as a test of whether a
significant value of impressions can be taken from your competition. If
your own portion of impressions does not increase, the bid should be
further reduced, otherwise there will be unnecessarily high costs for
the same performance.
3. The competition is exceeded, but in total the impression share is poor.
In this case, there is the possibility of reducing your own bids. The
goal of this is to increase your own impression share and at the same
time to use your own budget more effectively. However, through lower
offers, you accept a poorer display position.
As the responsible party, you should therefore balance out whether
your displays absolutely should be delivered in the first position,
because the same number of impressions can be obtained in positions two
and three for the same budget. Thus, your own impression share can
increase and can be better used by the low CPC bids of your overall
budget.
4. The impression share is poor and the competition is performing better.
This scenario is the worst case. If the campaign still performs well,
the budget can be increased if this is a possibility. If a budget
increase is not an option or the campaign performance does not warrant
an increase, the account and the campaigns should be analyzed in detail,
thus creating new potential for optimization.
Time Frames – On Which Days are Your Competitors Particularly Active?
The active time frames of your competitors are not apparent at first
glance in the auction insights report, because the report must first be
segmented according to the desired time frame. As a result, the auction
insights report offers granular information, for example segmented
according to weekdays.

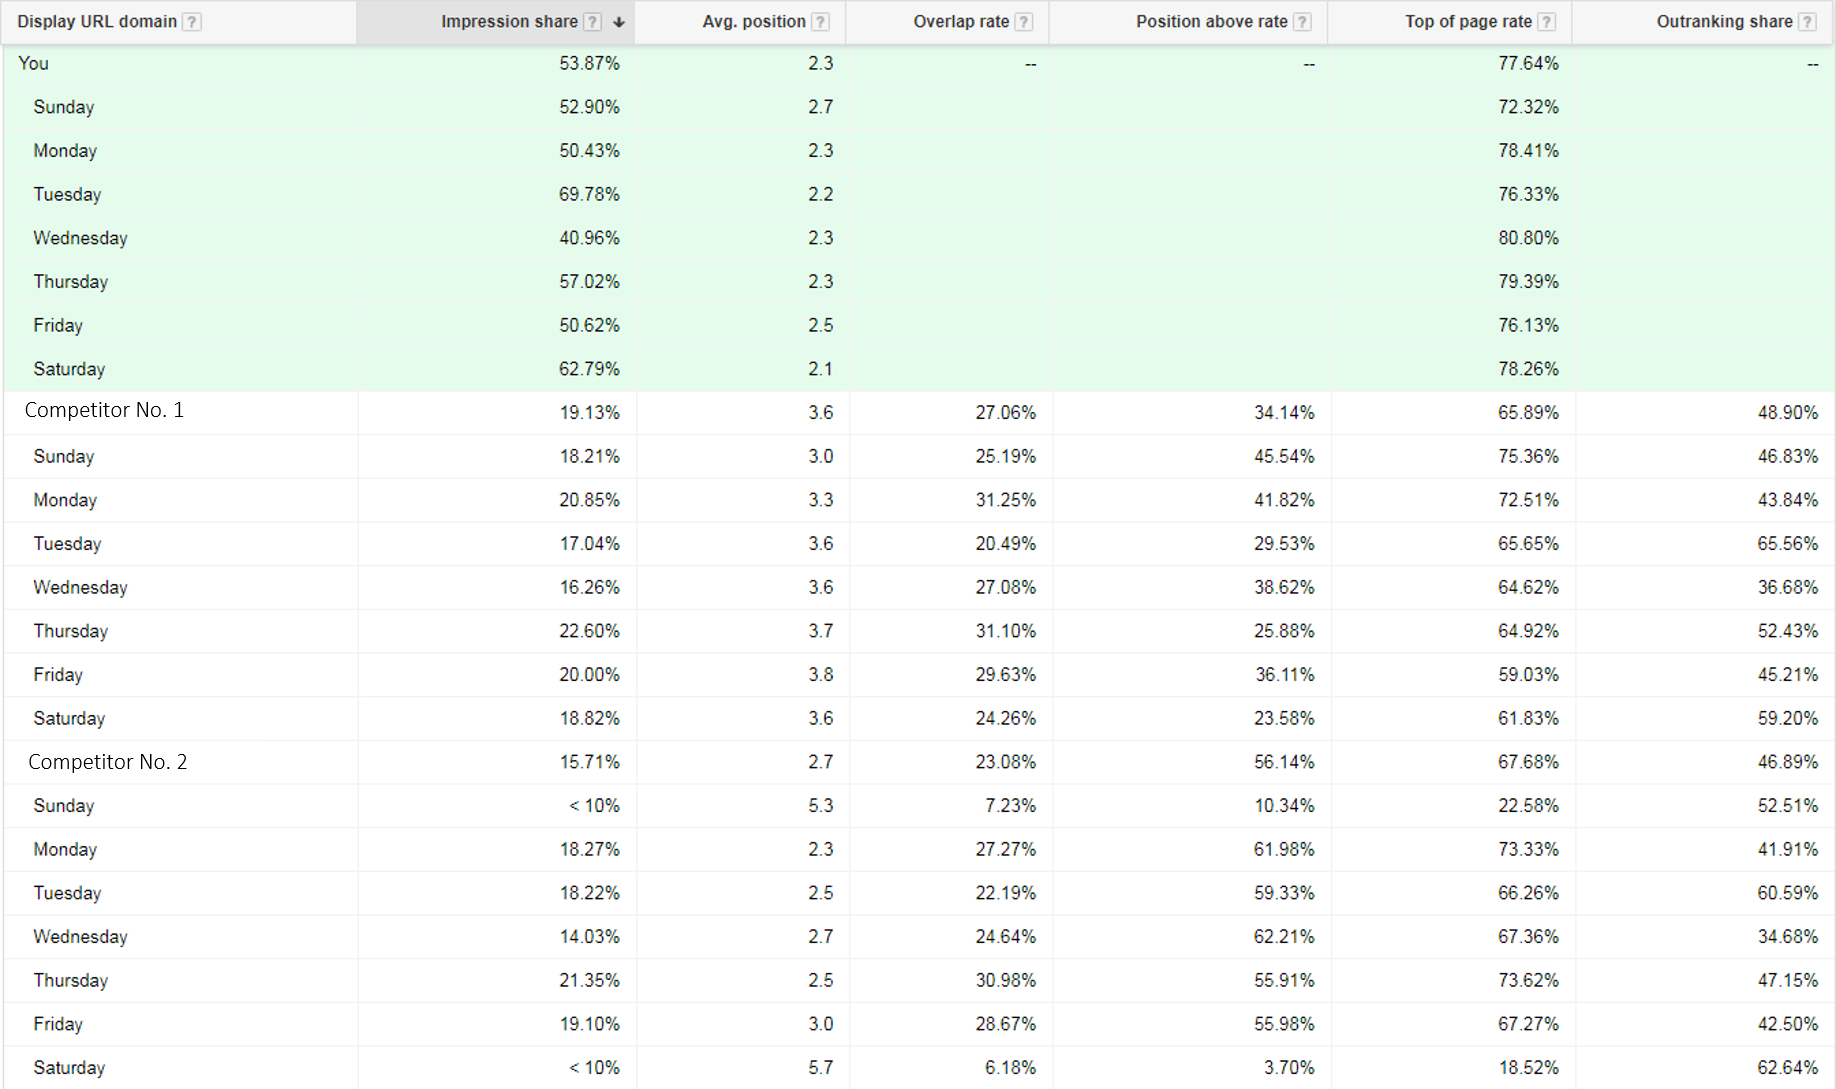
Figure 2: Segmenting according to
time frames, e.g., weekdays, shows how many impressions your competitors
achieve on the various weekdays.
This information and data are useful for finding out on which
weekdays the competitors place their focus. On these days, the
competitors’ bids are oriented to achieve as many impressions as
possible. In reverse, it is apparent on which days competitors switch to
none or only a few displays and thus submit low bids. The assumption is
then made that on certain days, the search volume is low, for example
at the weekend.
Thus, time frames/weekdays can be identified on which your own market
share can be increased with low bids. This possibility does not exist
on the days on which your competitors perform well. Here, only your own
data can be evaluated, and on this basis, measures for optimization can
be undertaken. With both approaches, it is important to include your own
performance data in the analysis.
The Device: Smartphone, Tablet, or Desktop – Which devices are Used for Advertising?
The analysis of device types rests on the points mentioned above. In
this case, the auction insights report in AdWords is segmented according
to device types instead of by time frames. From this, it is apparent on
which type of devices your competitors focus. Thus, it can be
established where the data overlaps, and is offered in an auction
together with your competitors. The competitors’ weaknesses open new
optimization potentials in comparison with your own data.
Thus, it pays to be sure that your own database always lays the
foundation for optimizations. Should a certain device type not perform
well, it should not be pushed in make-or-break fashion. This will most
likely not work.
Manage the Flood of Data – Sensibly Evaluate the Auction Insights Report
The amount of data that is made available in the auction insights
report is immense, and there are many different approaches to evaluating
this.
Firstly, it is important to choose the period under review suitably –
a longer review period is recommended. A review period that is too
short can lead to false conclusions, because insufficient data is
available for the basis. Anomalies or outliers have a much greater
influence. However, if the market portion of a competition sinks over a
longer time frame, this is a sure sign for optimization potential. There
are opportunities to fill the gaps arising with your own displays. A
deep analysis according to device types and time frames, typically
weekdays, then delivers more exact data and information on when and how
the gaps arising can be filled.
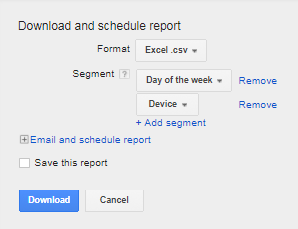
When downloading the report, you can add more than one segment; this
isn’t possible when simply viewing the AdWords interface. In the
download dialog, several segments can be added. Thus, in Excel, deep
analysis over several segments is possible. In addition, it helps to
evaluate the data and to present it as a diagram; in this way, trends
and changes can quickly be recognized. In the data tables, the suitable
quantitative data can be selected.

Figure 4: Segmenting possibilities of the auction data report in the download dialog of the current AdWords interface.
Strengthen the Effect of Your own Campaigns – The Next Steps
The points and steps presented above are only the tip of the iceberg
for a comprehensive and far-reaching competition analysis. Further
potential for optimization is hidden below the surface. A notice that
your own keywords could be prepared too broadly is shown by the
overlapping rate. If this is very high with the campaigns of
non-competitors, it is recommended to check the keywords. Optimizing
your own keyword set contributes to enlarging your own displays in a
targeted fashion.
Should the overlap with your competitors be particularly high, the
auction insights report delivers the first indications on optimization
on the keyword level. For example, you can analyze whether there is
competition with regard to important keywords. Moreover, it is apparent
whether the overlap takes place with less important keywords.
The auction data report delivers to you your concrete competition,
thus providing you opportunity to analyze your competitors’ landing
pages. The analysis forms the starting point for the development of your
own A/B test. Well designed and user-friendly landing pages do not
influence the user signals; they also contribute indirectly to the
quality factor of a keyword. In the end, the quality factor has an
effect on the display position and the CPC.
Conclusion
For a far-reaching analysis of competition, the auction insights
report offers a good basis and valuable insights for optimizing your
AdWords account. The comparison with the performance data of your own
campaigns can thus uncover previously undervalued potentials. These can
also extend beyond Google AdWords in part. With all the possibilities
that suddenly present themselves, your own data should always be
included and considered.


Comments
Post a Comment